Debugging Go project
prepare:

+ vscode
+ golang 1.92
demo
go mod init test
In main.go file
package main

import (
"fmt"
)

// Swap functions
func swap(x, y *string) (string, string) {
//XOR exchange
*x, *y = *y, *x
}

func main() {
fmt.Println("Hello, world!")
//Swap functions
for i := 0; i < 10; i++ {
a := "a"
b := "b"
swap(&a, &b)
fmt.Println(a, b)
}
}
vscode generates tests with one click
>gotest for package/function
::: tip They are to generate test units for packages and test units for functions. :::
Generated as follows:
package main

import (
"testing"
)

func Test_main(t *testing.T) {
tests := []struct {
name string
}{
// TODO: Add test cases.
}
for _, tt := range tests {
t.Run(tt.name, func(t *testing.T) {
main()
})
}
}

func Test_swap(t *testing.T) {
type args struct {
x*string
y*string
}
tests := []struct {
name string
args args
want string
want1 string
}{
// TODO: Add test cases.
}
for _, tt := range tests {
t.Run(tt.name, func(t *testing.T) {
got, got1 := swap(tt.args.x, tt.args.y)
if got != tt.want {
t.Errorf("swap() got = %v, want %v", got, tt.want)
}
if got1 != tt.want1 {
t.Errorf("swap() got1 = %v, want %v", got1, tt.want1)
}
})
}
}
We can just give the test in TODO: Add test cases.:
There are also shortcut keys. Let’s add a {} first:
>go:file struct
generate:
package main

import (
"testing"
)

func Test_main(t *testing.T) {
tests := []struct {
name string
}{
// TODO: Add test cases.
{
name: "test",
},
}
for _, tt := range tests {
t.Run(tt.name, func(t *testing.T) {
main()
})
}
}

func Test_swap(t *testing.T) {
type args struct {
x*string
y*string
}
tests := []struct {
name string
args args
want string
want1 string
}{
// TODO: Add test cases.
{
name: "afsdfwe",
args: args{
x: 12,
y: 214,
},
want: "shabi",
want1: "wangshan ",
},
{
name: "23asdfs",
args: args{
x: 1254,
y: 421,
},
want: "afswedwe",
want1: "3erasfdsa",
},
}
for _, tt := range tests {
t.Run(tt.name, func(t *testing.T) {
got, got1 := swap(tt.args.x, tt.args.y)
if got != tt.want {
t.Errorf("swap() got = %v, want %v", got, tt.want)
}
if got1 != tt.want1 {
t.Errorf("swap() got1 = %v, want %v", got1, tt.want1)
}
})
}
}
test
Just like our test case above, when we return to the test case, we can directly design breakpoint debugging
Select Type (Test Type):
"mode": "test"
Can be remote
remote, or selectdebug
Directory where the test file is located:
"program": "${file}"
::: warning
{
     "name": "Launch test function",
     "type": "go",
     "request": "launch",
     "mode": "test",
     "program": "${workspaceFolder}",
     "args": [
         "-test.run",
         "MyTestFunction"
     ]
}
:::
Completeness test
We need to set program in a specific directory, for example:
{
     "configurations": [
         {
             "name": "Launch Package",
             "type": "go",
             "request": "launch",
             "mode": "auto",
             "program": "${fileDirname}/../main"
         },
         {
             "name": "Connect to server",
             "type": "go",
             "request": "attach",
             "mode": "remote",
             "remotePath": "${workspaceFolder}",
             "port": 22,
             "host": "192.168.71.130"
         }
     ]
}
Specify function (function) test:
// Swap functions
func swap(x, y *string) (string, string) {
//XOR exchange
*x, *y = *y, *x
return *x, *y
}
You need to specify the test parameter to specify the specific test function:
{
     "name": "Launch test function",
     "type": "go",
     "request": "launch",
     "mode": "test",
     "program": "${workspaceFolder}",
     "args": [
         "-test.run",
         "MyTestFunction"
     ]
},
vscode remote debugging
::: tip When applied to remote-attach configurations, will look for “dlv … –headless –listen=:” server started externally. In dlv-dap mode, this will apply to all other configurations as well. The extension will try to connect to an external server started with “dlv dap –listen=:” to ask it to launch/attach to the target process. :::
First we need to start a devle server
dlv --headless debug Test
We can simulate this call on another terminal or machine:
root@cubmaster01:~/go/src/k8s.io/kubernetes# dlv connect localhost:40609
Type 'help' for list of commands.
(dlv) break main.go:32
Breakpoint 1 set at 0x4a05b2 for main.main() /workspces/test/main.go:32
(dlv)continue
> main.main() /workspces/test/main.go:32 (hits goroutine(1):1 total:1) (PC: 0x4a05b2)
     27: gid, _ := strconv.ParseInt(idField, 10, 64)
     28: return gid
     29: }
     30:
     31: func main() {
=> 32: debug()
     33: }
**Create the .vscode folder (mod rootfs directory) and create it below: **
Create
settings.jsonCreate
launch.jsonand write{ //Use IntelliSense to learn about related properties. //Hover to see a description of an existing property. //For more information, please visit: https://go.microsoft.com/fwlink/?linkid=830387 "version": "0.2.0", "configurations": [ { "name": "Cconnected to server", "type": "go", "request": "attach", "mode": "remote", "remotePath": "/workspace/sealer", "port": 22, "host": "192.168.71.130" }, { "name": "Launch file", "type": "go", "request": "launch", "mode": "debug", "program": "${file}" } ] }
::: warning For convenience, you can create it directly in the debugging window with one click
:::
dlv + VSCode + Go development environment construction
::: tip required questions The project requires a gcc/c++ environment, or a large project needs to be built (sealos, sealer, kubernets, prometheus )
**I need: ** Use the vscode editor to write go, then compile and debug (break points).
:::
dlv is an abbreviation. In fact, delve is the full name. dlv is just a startup command. If you use VScode, the default debugger is based on delve.
Common commands
| Commands | Usage | Practice |
| ——- | —————————————— —————— | —– |
| attach | This command will cause Delve to take control of an already running process and start a new debugging session. When exiting a debugging session, you can choose to keep the process running or kill it. | case1 |
| exec | This command will cause Delve to execute the binary and immediately attach to it, starting a new debugging session. Note that if a binary is compiled without optimizations turned off, it may be difficult to debug it correctly. Please consider compiling debug binaries with -gcflags=“all=-N -l " on Go 1.10 or later, and -gcflags="-N -l” on earlier versions of Go. | case2 |
| help | manual | case3 |
| debug | By default, without parameters, Delve will compile the “main” package in the current directory and start debugging. Alternatively, you can specify a package name and Delve will compile the package and start a new debugging session. | case4 |
| test | The test command allows you to start a new debugging session in the context of unit testing. By default, Delve will debug tests in the current directory. Additionally, you can specify the name of a package in which Delve will debug tests. The double dash -- can be used to pass parameters to the test program. |case5|
| version | Check dlv version | case6 |
goroutine
dlv specially supports goroutine
- goroutine
- gorouties
- thread
- threads
dlv debugging instructions
Breakpoint management
| Commands | Abbreviations | Usage | Examples |
|---|---|---|---|
| break | b | set breakpoint | case7 |
| breakpoints | bp | View all current breakpoints | case8 |
| clear | / | delete breakpoint | case9 |
| clearall | / | Delete multiple breakpoints | case10 |
| toggle | / | Enable or disable breakpoints | case11 |
Debugging instructions during program execution
| Commands | Abbreviations | Usage | Examples | | —————- | —- | ————————– —– | —— | | continue | c | Continue execution to a breakpoint or the end of the program | case12 | | next | n | execute the next line of code | case13 | | restart | r | Re-execute the program | case14 | | step | s | The next step in executing the code | case15 | | step-instruction | si | Execute the next line of machine code | case16 | | stepout | so | jump out of the currently executing function | case17 |
Parameter management
| Commands | Abbreviations | Usage | Examples | | ——- | —- | ———————————- ————————– | —— | | args | / | Print function input | case18 | | display | / | Print the value of the variable added to display, each time the next line of code or the next breakpoint is executed | case19 | | locals | / | print local variables | case20 | | print | p | Print the result of an expression | case21 | | set | / | Set the value of a variable | case22 | | vars | / | View global variables | case23 | | whatis | / | View variable type | case24 |
other
| Commands | Abbreviations | Usage | Examples | | ———– | ——– | ————————– | - —– | | disassemble | disass | View decompiled code, machine code | case25 | | exit | quit / q | exit | case26 | | funcs | / | Print all functions used by the program | case27 | | help | h | Help information | case28 | | list | ls / l | print code | case29 |
A suitable process starts our debugging journey:
- Create the corresponding directory. Go to
/usr/local/go/bin/github.com/to create such a path. After creation, there should be such a path/usr/local/go/bin/github.com/derekparker/delve. - Download the git library that debugging depends on:
https://github.com/derekparker/delveneeds to zip the package directly, then unzip the source code, and then put the source code directly into the above path (the above path should Directly from the source code, you can find the Makefile!!!!). - Execute the command
make install. - Configure the launch.json file of VSCode. The specific configuration is provided with a link to the official website. You can read it yourself in English. If you can’t understand it, you don’t deserve to read this article.
https://github.com/Microsoft/vscode-go/wiki/Debugging-Go-code-using-VS-Code. - Test at break points (the test project can be the hello.go file we wrote at the beginning).
Install dlv
git clone https://github.com/go-delve/delve.git $GOPATH/src/github.com/go-delve/delve
cd $GOPATH/src/github.com/go-delve/delve
make install
export PATH=$PATH:$GOPATH/bin

dlv version
Or use get:
go get github.com/derekparker/delve/cmd/dlv
Add debug solution
In addition, you need to add the corresponding debug scheme (debug configuration) to Visual Code. On the menu bar of Visual Code, open the launch.json editing interface through Debug->Open Configurations. In the configurations array, add the following content and save the file.
{
     "name": "Launch remote",
     "type": "go",
     "request": "launch",
     "mode": "remote",
     "remotePath": "/root/go/src/hello",
     "port": 2345,
     "host": "192.168.33.123",
     "program": "${fileDirname}",
     "env": {}
}
Execution method
**dlv’s debug remote debugging requires both the remote and near ends to hold all source code files. **For convenience, thisThe GOPATH is not changed here, and the entire project is directly thrown into $GOPATH/src on the remote end.
The source code file path is $GOPATH/src/hello/main.go
On the local end, create the hello directory directly and place the source code files directly in it.
dlv debug --headless --listen ":2345" --log --api-version 2
If the following content is displayed on the screen, it means that the dlv server is ready.
API server listening at: [::]:2345
INFO[0004] launching process with args: [/root/go/src/hello/debug] layer=debugger
Then, return to Visual Code and enter the debug interface. After selecting the “Launch remote” plan, click Start to run go debugger to start remote debugging. Most operations are the same as local debugging, and stacks, variables, and watches can all be used normally.
dlv 💡A simple case
PS D:\Documents\my\test> dlv exec .\main.exe
Type 'help' for list of commands.
(dlv) b
Breakpoint 1 set at 0x7ffc6a490651 for :0
(dlv) b main.main
Breakpoint 2 set at 0xe7e48f for main.main() d:/documentation/my/test/main.go:14
(dlv) c
Stopped at: 0x7ffc6a490651
=> 1: no source available
(dlv) b main.swap
Breakpoint 3 set at 0xe7e51c for main.main() d:/documentation/my/test/main.go:10
(dlv) c
> main.main() d:/documentation/my/test/main.go:14 (hits goroutine(1):1 total:1) (PC: 0xe7e48f)
Warning: debugging optimized function
      9: //XOR exchange
     10: *x, *y = *y, *x
     11: return *x, *y
     12: }
     13:
=> 14: func main() {
     15: fmt.Println("Hello, world!")
     16: //Swap functions
     17: for i := 0; i < 10; i++ {
     18: a := "a"
     19: b := "b"
(dlv)bp
Breakpoint runtime-fatal-throw (enabled) at 0xe24a20,0xe24b20 for (multiple functions)() d:/app/go/src/runtime/panic.go:1059 (0)
Breakpoint unrecovered-panic (enabled) at 0xe24ec0 for runtime.fatalpanic() d:/app/go/src/runtime/panic.go:1143 (0)
         print runtime.curg._panic.arg
Breakpoint 1 (enabled) at 0x7ffc6a490651 for :0 (1)
Breakpoint 2 (enabled) at 0xe7e48f for main.main() d:/documentation/my/test/main.go:14 (1)
Breakpoint 3 (enabled) at 0xe7e51c for main.main() d:/documentation/my/test/main.go:10 (0)
(dlv) clear 2
Breakpoint 2 cleared at 0xe7e48f for main.main() d:/documentation/my/test/main.go:14
(dlv)bp
Breakpoint runtime-fatal-throw (enabled) at 0xe24a20,0xe24b20 for (multiple functions)() d:/app/go/src/runtime/panic.go:1059 (0)
Breakpoint unrecovered-panic (enabled) at 0xe24ec0 for runtime.fatalpanic() d:/app/go/src/runtime/panic.go:1143 (0)
         print runtime.curg._panic.arg
Breakpoint 1 (enabled) at 0x7ffc6a490651 for :0 (1)
Breakpoint 3 (enabled) at 0xe7e51c for main.main() d:/documentation/my/test/main.go:10 (0)
(dlv)ls
> main.main() d:/documentation/my/test/main.go:14 (PC: 0xe7e48f)
Warning: debugging optimized function
      9: //XOR exchange
     10: *x, *y = *y, *x
     11: return *x, *y
     12: }
     13:
=> 14: func main() {
     15: fmt.Println("Hello, world!")
     16: //Swap functions
     17: for i := 0; i < 10; i++ {
     18: a := "a"
     19: b := "b"
(dlv)
Start the program with parameters (
dlv exec ./GoDbg -- arg1 arg2)[lday@alex GoDbg]$ dlv exec ./GoDbg -- arg1 arg2 Type 'help' for list of commands. (dlv)Set a breakpoint (
b) on the main function(dlv) b main.main Breakpoint 1 set at 0x40101b for main.main() ./main.go:9Start debugging and continue execution after breakpoint (
c)(dlv) c > main.main() ./main.go:9 (hits goroutine(1):1 total:1) (PC: 0x40101b) 4: "GoWorks/GoDbg/mylib" 5: "fmt" 6: "os" 7: ) 8: => 9: func main() { 10: fmt.Println("Golang dbg test...") 11: 12: var argc = len(os.Args) 13: var argv = append([]string{}, os.Args...) 14:Set a breakpoint (
b) by line number on the file dbgTest.go(dlv) b dbgTest.go:17 Breakpoint 2 set at 0x457f51 for GoWorks/GoDbg/mylib.DBGTestRun() ./mylib/dbgTest.go:17 (dlv) b dbgTest.go:23 Breakpoint 3 set at 0x4580d0 for GoWorks/GoDbg/mylib.DBGTestRun() ./mylib/dbgTest.go:23 (dlv) b dbgTest.go:26 Breakpoint 4 set at 0x458123 for GoWorks/GoDbg/mylib.DBGTestRun() ./mylib/dbgTest.go:26 (dlv) b dbgTest.go:29 Breakpoint 5 set at 0x458166 for GoWorks/GoDbg/mylib.DBGTestRun() ./mylib/dbgTest.go:29Display a list of all breakpoints (
bp)(dlv)bp Breakpoint unrecovered-panic at 0x429690 for runtime.startpanic() /home/lday/Tools/Dev_Tools/Go_Tools/go_1_6_2/src/runtime/panic.go:524 (0) Breakpoint 1 at 0x40101b for main.main() ./main.go:9 (1) Breakpoint 2 at 0x457f51 for GoWorks/GoDbg/mylib.DBGTestRun() ./mylib/dbgTest.go:17 (0) Breakpoint 3 at 0x4580d0 for GoWorks/GoDbg/mylib.DBGTestRun() ./mylib/dbgTest.go:23 (0) Breakpoint 4 at 0x458123 for GoWorks/GoDbg/mylib.DBGTestRun() ./mylib/dbgTest.go:26 (0) Breakpoint 5 at 0x458166 for GoWorks/GoDbg/mylib.DBGTestRun() ./mylib/dbgTest.go:29 (0)Dlv does not seem to provide a function similar to gdb`dis However, this function is of little use.
Delete a breakpoint (
clear x)(dlv) clear 5 Breakpoint 5 cleared at 0x458166 for GoWorks/GoDbg/mylib.DBGTestRun() ./mylib/dbgTest.go:29 (dlv)bp Breakpoint unrecovered-panic at 0x429690 for runtime.startpanic() /home/lday/Tools/Dev_Tools/Go_Tools/go_1_6_2/src/runtime/panic.go:524 (0) Breakpoint 1at 0x40101b for main.main() ./main.go:9 (1) Breakpoint 2 at 0x457f51 for GoWorks/GoDbg/mylib.DBGTestRun() ./mylib/dbgTest.go:17 (0) Breakpoint 3 at 0x4580d0 for GoWorks/GoDbg/mylib.DBGTestRun() ./mylib/dbgTest.go:23 (0) Breakpoint 4 at 0x458123 for GoWorks/GoDbg/mylib.DBGTestRun() ./mylib/dbgTest.go:26 (0)Display the currently running code location (
ls)(dlv)ls > GoWorks/GoDbg/mylib.DBGTestRun() ./mylib/dbgTest.go:17 (hits goroutine(1):1 total:1) (PC: 0x457f51) 12: C map[int]string 13: D[]string 14: } 15: 16: func DBGTestRun(var1 int, var2 string, var3 []int, var4 MyStruct) { => 17: fmt.Println("DBGTestRun Begin!\n") 18: waiter := &sync.WaitGroup{} 19: 20: waiter.Add(1) 21: go RunFunc1(var1, waiter) twenty two:View current call stack information (
bt)(dlv) bt 0 0x0000000000457f51 in GoWorks/GoDbg/mylib.DBGTestRun at ./mylib/dbgTest.go:17 1 0x0000000000401818 in main.main at ./main.go:27 2 0x000000000042aefb in runtime.main at /home/lday/Tools/Dev_Tools/Go_Tools/go_1_6_2/src/runtime/proc.go:188 3 0x0000000000456df0 in runtime.goexit at /home/lday/Tools/Dev_Tools/Go_Tools/go_1_6_2/src/runtime/asm_amd64.s:1998Output variable information (
print/p)(dlv) print var1 1 (dlv) print var2 "golang dbg test" (dlv) print var3 []int len: 3, cap: 3, [1,2,3] (dlv) print var4 GoWorks/GoDbg/mylib.MyStruct { A: 1, B: "golang dbg my struct field B", C: map[int]string [ 1: "value1", 2: "value2", 3: "value3", ], D: []string len: 3, cap: 3, ["D1","D2","D3"],}*By analogy with gdb debugging, we see that when we used gdb for debugging before, we found that gdb could not output the contents of var3 and var4 at this time, but dlv could*
Execute the corresponding instruction (
frame n cmd) on the nth call stack(dlv) frame 1ls 22: var4.A = 1 23: var4.B = "golang dbg my struct field B" 24: var4.C = map[int]string{1: "value1", 2: "value2", 3: "value3"} 25: var4.D = []string{"D1", "D2", "D3"} 26: => 27: mylib.DBGTestRun(var1, var2, var3, var4) 28: fmt.Println("Golang dbg test over") 29: }frame 1 lswill display the specific execution position of the program on the first layer of the call stackView goroutine information (
goroutines) When we execute todbgTest.go:26, we have started two goroutines(dlv) > GoWorks/GoDbg/mylib.DBGTestRun() ./mylib/dbgTest.go:26 (hits goroutine(1):1 total:1) (PC: 0x458123) 21: go RunFunc1(var1, waiter) twenty two: 23: waiter.Add(1) 24: go RunFunc2(var2, waiter) 25: => 26: waiter.Add(1) 27: go RunFunc3(&var3, waiter) 28: 29: waiter.Add(1) 30: go RunFunc4(&var4, waiter) 31:At this point we will check the goroutine status information of the program
(dlv) goroutines
[6 goroutines]
* Goroutine 1 - User: ./mylib/dbgTest.go:26 GoWorks/GoDbg/mylib.DBGTestRun (0x458123) (thread 9022)
  Goroutine 2 - User: /home/lday/Tools/Dev_Tools/Go_Tools/go_1_6_2/src/runtime/proc.go:263 runtime.gopark (0x42b2d3)
  Goroutine 3 - User: /home/lday/Tools/Dev_Tools/Go_Tools/go_1_6_2/src/runtime/proc.go:263 runtime.gopark (0x42b2d3)
  Goroutine 4 - User: /home/lday/Tools/Dev_Tools/Go_Tools/go_1_6_2/src/runtime/proc.go:263 runtime.gopark (0x42b2d3)
  Goroutine 5 - User: ./mylib/dbgTest.go:39 GoWorks/GoDbg/mylib.RunFunc1 (0x4583eb) (thread 9035)
  Goroutine 6 - User: /home/lday/Tools/Dev_Tools/Go_Tools/go_1_6_2/src/fmt/format.go:130 fmt.(*fmt).padString (0x459545)
Judging from the output information, goroutine 5 started first executes
RunFunc1and has not yet executedfmt.Printf. Then goroutine 6 started next executesRunFunc2and has enteredfmt.Printf. Internal call in progressFurther view goroutine information (
goroutine x) Continuing the operation of step 11, at this time I want to check the specific execution of goroutine 6, then executegoroutine 6(dlv) goroutine 6 Switched from 1 to 6 (thread 9022)On this basis, execute
bt, and you can see the current goroutine call stack.(dlv) bt 0 0x0000000000454730 in runtime.systemstack_switch at /home/lday/Tools/Dev_Tools/Go_Tools/go_1_6_2/src/runtime/asm_amd64.s:245 1 0x000000000040f700 in runtime.mallocgc at /home/lday/Tools/Dev_Tools/Go_Tools/go_1_6_2/src/runtime/malloc.go:643 2 0x000000000040fc43 in runtime.rawmem at /home/lday/Tools/Dev_Tools/Go_Tools/go_1_6_2/src/runtime/malloc.go:809 3 0x000000000043c2a5 in runtime.growslice at /home/lday/Tools/Dev_Tools/Go_Tools/go_1_6_2/src/runtime/slice.go:95 4 0x000000000043c015 in runtime.growslice_n at /home/lday/Tools/Dev_Tools/Go_Tools/go_1_6_2/src/runtime/slice.go:44 5 0x0000000000459545 in fmt.(*fmt).padString at /home/lday/Tools/Dev_Tools/Go_Tools/go_1_6_2/src/fmt/format.go:130 6 0x000000000045a13f in fmt.(*fmt).fmt_s at /home/lday/Tools/Dev_Tools/Go_Tools/go_1_6_2/src/fmt/format.go:322 7 0x000000000045e905 in fmt.(*pp).fmtString at /home/lday/Tools/Dev_Tools/Go_Tools/go_1_6_2/src/fmt/print.go:518 8 0x000000000046200f in fmt.(*pp).printArg at /home/lday/Tools/Dev_Tools/Go_Tools/go_1_6_2/src/fmt/print.go:797 9 0x0000000000468a8d in fmt.(*pp).doPrintf at /home/lday/Tools/Dev_Tools/Go_Tools/go_1_6_2/src/fmt/print.go:1238 10 0x000000000045c654 in fmt.Fprintf at /home/lday/Tools/Dev_Tools/Go_Tools/go_1_6_2/src/fmt/print.go:188At this time, 10 layers of call stacks are output, but it seems that the call stack of the original program dbgTest.go has no output. We can set the output depth of bt by adding the depth parameter to
bt, and then find our own call stack. For examplebt 13(dlv) bt 13 ... 10 0x000000000045c654 in fmt.Fprintf at /home/lday/Tools/Dev_Tools/Go_Tools/go_1_6_2/src/fmt/print.go:188 11 0x000000000045c74b in fmt.Printf at /home/lday/Tools/Dev_Tools/Go_Tools/go_1_6_2/src/fmt/print.go:197 12 0x000000000045846f in GoWorks/GoDbg/mylib.RunFunc2 at ./mylib/dbgTest.go:50 13 0x0000000000456df0 in runtime.goexit at /home/lday/Tools/Dev_Tools/Go_Tools/go_1_6_2/src/runtime/asm_amd64.s:1998We see that our own dbgTest.go call stack is on layer 12. The current goroutine is no longer on our own call stack, but has entered the call of the system function. In this case, when using gdb to debug, we found that we have no good way to output what we need at this time. Call stack variable information. dlv is OK! At this time, we can simply use
frame x cmdto output the call stack information we want.(dlv) frame 12ls 45: time.Sleep(10 * time.Second) 46: waiter.Done() 47: } 48: 49: func RunFunc2(variable string, waiter *sync.WaitGroup) { => 50: fmt.Printf("var2:%v\n", variable) 51: time.Sleep(10 * time.Second) 52: waiter.Done() 53: } 54: 55: func RunFunc3(pVariable *[]int, waiter *sync.WaitGroup) { (dlv) frame 12 print variable "golang dbg test" (dlv) frame 12 print waiter *sync.WaitGroup { state1: [12]uint8 [0,0,0,0,2,0,0,0,0,0,0,0], sema: 0,}What a great feature!
Check which goroutine you are currently on (
goroutine) When usinggoroutinewithout parameters, dlv will display the current goroutine information, which can help us confirm whether we need to switch goroutine during debugging.(dlv) goroutine Thread 9022 at ./mylib/dbgTest.go:26 Goroutine 6: Runtime: /home/lday/Tools/Dev_Tools/Go_Tools/go_1_6_2/src/runtime/asm_amd64.s:245 runtime.systemstack_switch (0x454730) User: /home/lday/Tools/Dev_Tools/Go_Tools/go_1_6_2/src/fmt/format.go:130 fmt.(*fmt).padString (0x459545) Go: ./mylib/dbgTest.go:26 GoWorks/GoDbg/mylib.DBGTestRun (0x458123)
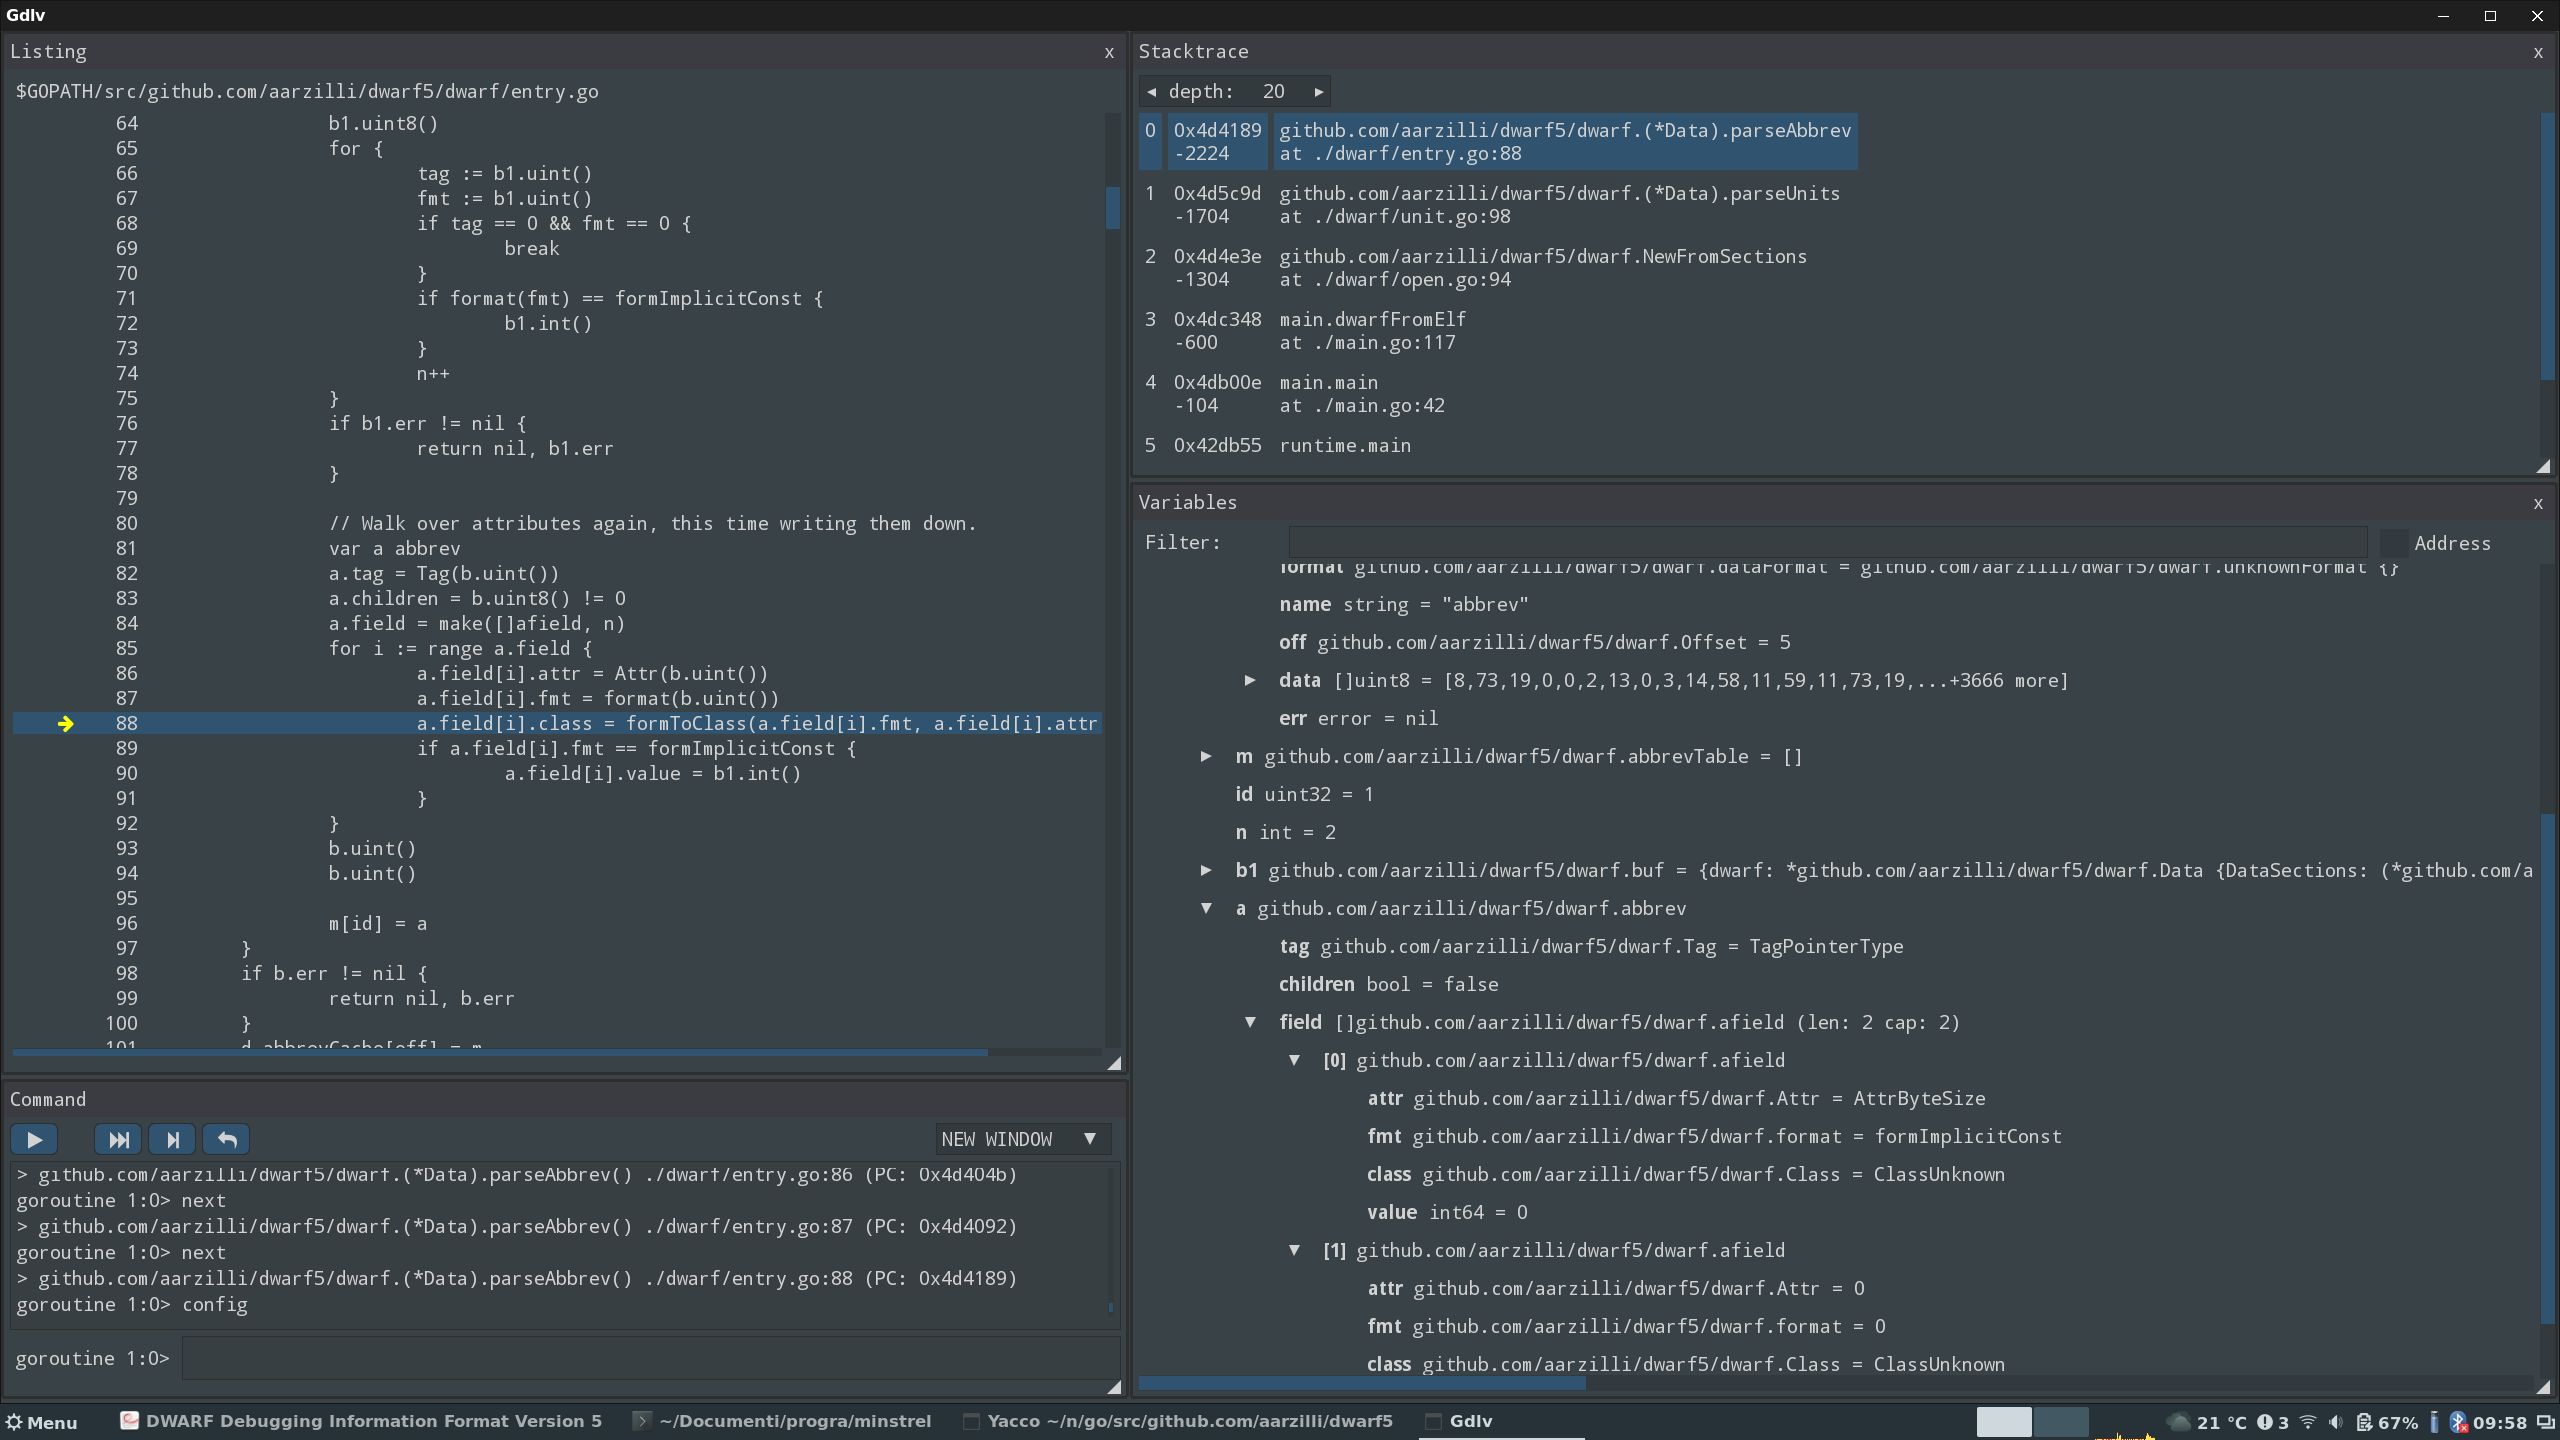
dlv front end (gdlv)
dlv provides a cli debugging system similar to gdb, and a third party also provides a GUI front end for dlv (gdlv
), for those who are used to using GUI for debugging Generally speaking, debugging will be more convenient by combining gdlv and dlv. One problem with gdlv is that it cannot run on xwindows server and can only run locally on the server.
in conclusion
Comprehensive comparison of the two Golang program debuggers gdb and dlv, I think dlv has more complete functions and can better meet the functional requirements during actual debugging. The advantages and disadvantages of the two are roughly compared as follows:
| Debugger | Advantages | Disadvantages | | :—-: | :—————————————: | :————————————————- —: | | dlv | Comprehensive support for goroutine and go type debugging | Only supports go, but does not support debugging of some Go internal bottom data | | gdb | In line with existing debugging habits, similar to C/C++ debugging instructions | Insufficient support for goroutine scenarios and cannot handle goroutine debugging well |
Summarize
Remote debugging of go programs through Visual Code+dlv is very helpful for debugging system-related issues in situations such as “Windows for development and Linux for production”. Moreover, Visual Code’s graphical interface and code prompts are really convenient.
However, the debugging method has two imperfections. The first is that in principle it requires remote compilation of the source code, which limits its usage scenarios other than development and testing environments, and also makes every debugging have to wait for it to compile; the other is because both the remote and near ends have to wait for it to compile. They must have the same source code. Whether it is dlv or the Go plug-in of Visual Code, currently there is no way to automatically upload the locally modified code to the remote end.
Responses